Using Excel Tools for Stage 1 Fundamental Research - LT Foods
In this blog, we will explore how by using excel productivity tools for stock analysis, we can quickly scan a stock and take a call whether it deserves a detailed fundamental analysis or not
With over 2000+ stocks listed on the National Stock Exchange, finding the right investment can be overwhelming. Filtering through this universe of stocks and analyzing a company's historical and present performance by analyzing its profits, balance sheet, and cash flow statement is key. Understanding all this is crucial for making smart investment choices. That's why we've developed a proprietary Excel tool. In just 2-3 hours, it enables investors to conduct stage 1 analysis of a particular company.
Now, the question arises: which company deserves a deeper dive? And if a company meets the criteria, what are the most important questions to check when diving deeper into analysis?
Let's consider LT Foods as an example to explore its performance over the years and determine if it meets the criteria for stage 2 fundamental analysis.
"Before we get into the details of our Excel tool, let's talk about LT Foods, the company we're analyzing today, which can be quickly picked up from company summary from websites like screener.in, Tijori etc.
LT Foods, with its rich history spanning over 70 years, is a global leader in the food industry, renowned for its high-quality rice and rice-based products. Operating in more than 80 countries, LT Foods has established itself as a dominant force in the Basmati rice market, capturing significant market shares both in the US and India.
Stick around as we dig into LT Foods and show you how our Excel tool works.
Out of the 15+ sheets we have, we've explained a few in our blog.
Let's take a look at the first sheet of the Excel tool: the Summary sheet, which is like a Financial Snapshot of a company. It shows how well a company is doing with respect to Sales, Margin and Cash Flow growth and also in terms of debt, working capital management by comparing data on 8Y, 5Y, 3Y, 1Y and TTM basis.
Additionally, it also includes the summary of Quarterly, Valuation and Business, therefore, giving a complete picture of the company’s comparing past and current performance.
Observations from the summary sheet Part 1:
Sales and EBITDA Growth: The company has shown robust growth in sales (12-19% CAGR) and EBITDA, indicating strong financial performance.
Debt Reduction: LT Foods has managed to significantly reduce its debt EBITDA/Interest from 2 to 8 in 5 years.
Effective Cash Flow Utilization: LT Foods has efficiently converted around 63-66% of its free cash flow, using it for growth capex, debt reduction, and dividends.
Observations from the summary sheet Part 2:
Relative Valuation Metrics: LT Foods is trading at a trailing 12M P/E ratio of 10.8, which seems to be costlier than the mean on relative valuation metrics.
Steady Sales Growth: Despite volatility, double digit sales and profit growth with expanding margins
The second sheet of our Excel tool focuses on Margin analysis, detailing how companies have performed based on various margin metrics like EBITDA, PBT, and PAT. It also tracks the breakdown of different expense components over the past years.
Observations from the Margin Analysis:
● Improved margins in LT Foods i.e., from 4% to 7.6% in the last 8 years due to structural changes.
● Raw material costs make up a large part of expenses- 72-73%.
● Selling, General, and Administrative (SGA) expenses follow raw material costs- 16% as of now.
● Interest costs have decreased gradually over time from 3% to 1%.
The main reason behind the improvement in margins, particularly the decrease in interest costs is because of the Balance sheet transformation. Which takes us to the next sheet i.e., Balance Sheet & Leverage Analysis providing insights into a company's financial structure and debt management.
Observations from the Balance Sheet & Leverage Analysis:
● On the liability side, LT Foods has observed significant changes i.e, borrowings share has decreased, and reserves have increased over the last 8 years.
● The current leverage state for LT Foods is comfortable, indicating strong transformation over the years.
● On the liability side (correction made), healthy reserves and lesser borrowing.
● Asset side inventory has huge item which accounts for almost 57% as of FY23.
After analyzing how the balance sheet has transformed for a particular company over the years, the next crucial step is to assess how efficiently the company is utilizing its cash resources. This brings us to the analysis of Cash Flow from Operations (CFO) and Free Cash Flow (FCF). CFO measures the cash generated from the company's core operations, while FCF represents the cash remaining after accounting for capital expenditures required to maintain or expand the business.
Observations from the Cashflow Analysis:
● The company's operating cash flows have shown consistent growth over the years, particularly on a 3-year rolling basis.
● However, there have been occasional declines in operating cash flows.
● Free cash flow growth has moved proportionally, with LT Foods now generating almost Rs 250+ Cr in FCF.
● This FCF represents almost 4% of sales, indicating the company's ability to convert a significant portion of its sales into cash flow.
Financial ratios play a crucial role in analyzing a company's financial statements, offering insights into its performance across various metrics. They help assess profitability, liquidity, solvency, and efficiency. These ratios serve as essential tools for investors, and other stakeholders in making informed decisions about the company.
This brings us to the next sheet, the margin analysis sheet.
Observations from the Return ratio Analysis:
● LT Foods has shown significant structural improvement in return ratios over the years.
● Return on assets (ROA), return on equity (ROE), and return on capital employed (ROCE) have all witnessed improvement.
● ROA 5% to 7%, ROE 14 to 15% and ROCE 14 to 15% in the last 3 years.
● Due to fall in leverage, the company has managed to enhance its return ratios.
● This improvement is attributed to better margins and a more efficient utilization of assets.
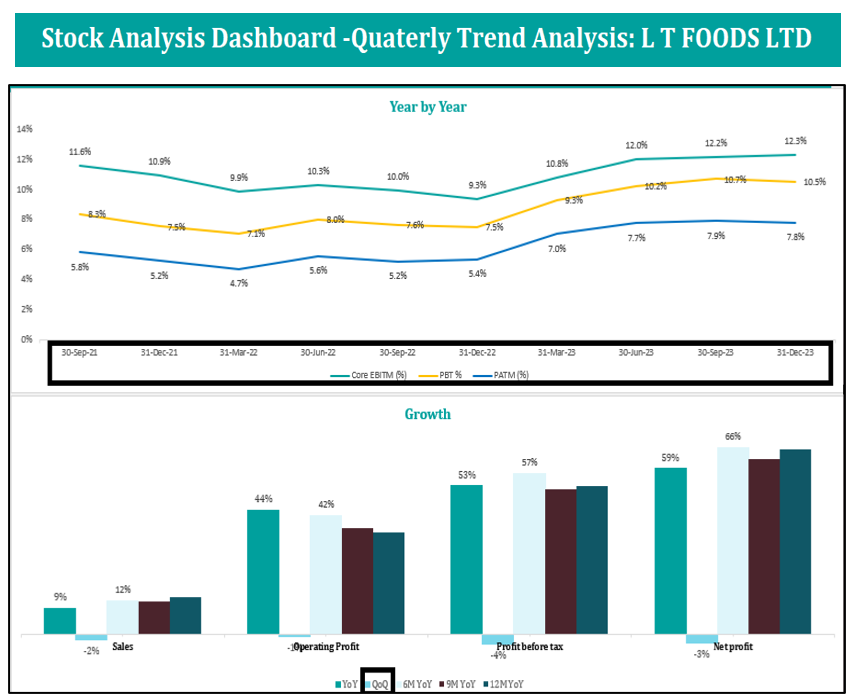
Now that we've thoroughly examined the company's margins, balance sheet, leverage, cash flow, and return ratios, it's time to delve into the quarterly trends. This sheet offers a closer look at the company's performance over specific quarters, allowing us to identify patterns, seasonal fluctuations, and any emerging trends. By analyzing quarterly data, we gain deeper insights into the company's operational dynamics and its ability to adapt to changing market conditions.
LT Foods Quarterly Trends Analysis:
● There is no significant seasonality component in LT Foods' business.
● The recent profit trajectory indicates stable and improving sales growth and margins.
Let's turn our attention to valuation, a critical aspect of assessing a company's investment potential. In addition to relative valuation metrics, such as price-to-earnings ratio or price-to-book ratio, it's essential to consider discounted cash flow (DCF) valuation metrics. Interestingly, LT Foods appears to be trading at a significant discount based on DCF valuation metrics, indicating potential undervaluation in the market.
Indeed, LT Foods requires stage 2 analysis. The company has met the criteria due to its remarkable balance sheet transformation. Despite operating in a high working capital-intensive sector, LT Foods has successfully expanded its margins and profitability. These factors indicate a strong foundation and potential for further growth and value creation.
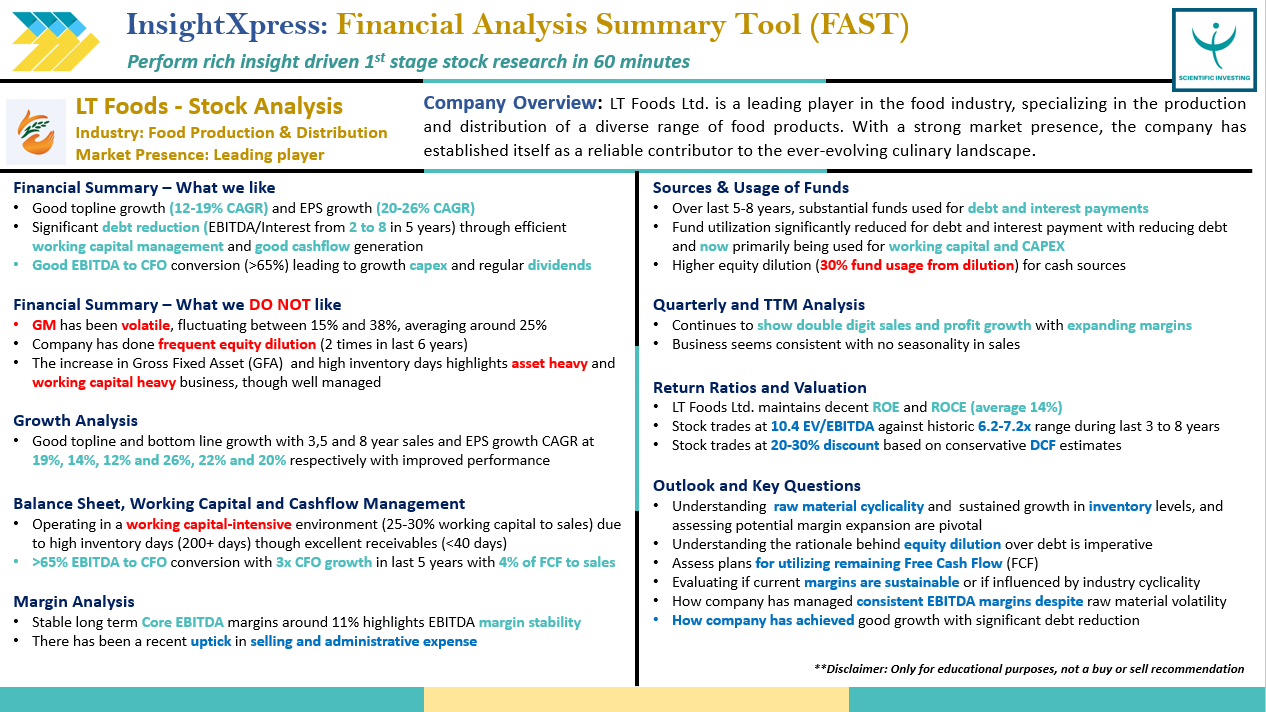
Also, with the help of our Excel tool, we've compiled a one-pager report on LT Foods, highlighting all the insights discussed and also the important questions to check when diving deeper into analysis. You can access the report through the following link: https://x.com/suru27/status/1742525570238324773?s=20 or ⬇️
Conclusion:
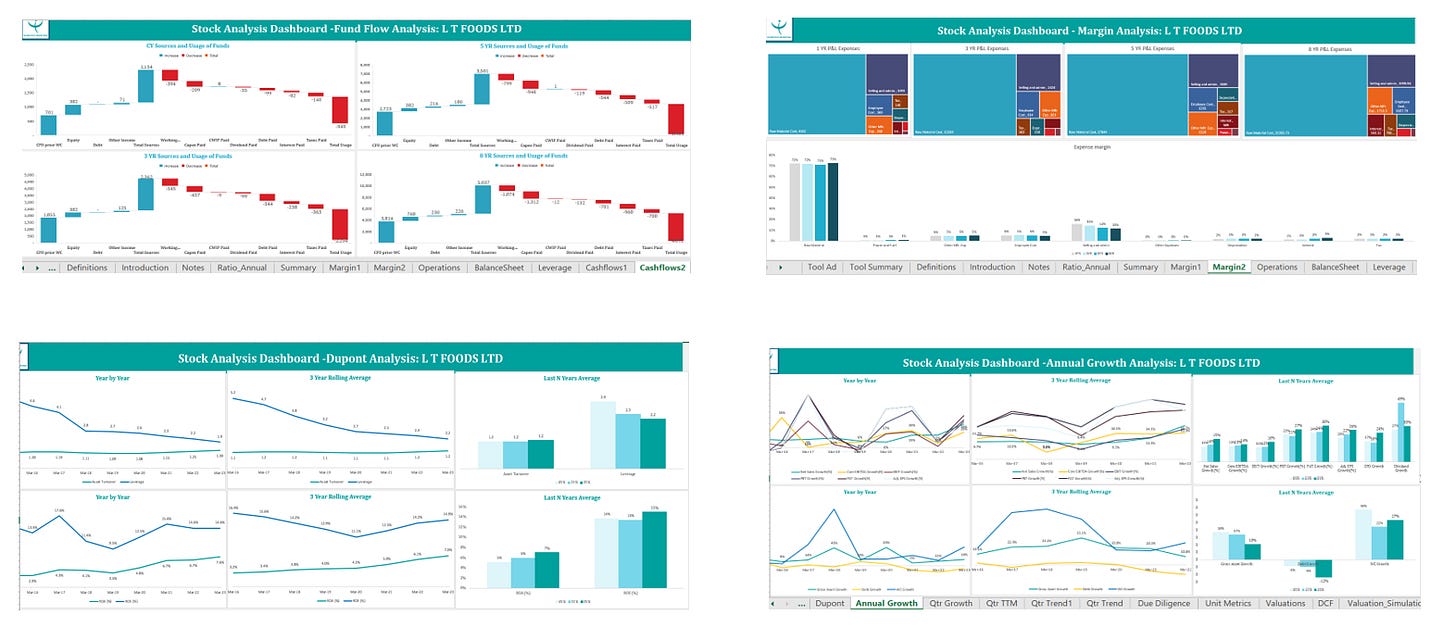
In this blog, we've explored just a small part of our Excel tool's capabilities, focusing on analyzing LT Foods. It's essential to remember that each company may require different levels of analysis. The image below shows all of the metrics which are covered in our tool.
If you're interested in delving deeper into our tool and exploring examples from different companies, we invite you to join our webinar. Our webinar covers everything you need to know about the tool, with real-life examples and insights. Plus, you'll gain lifetime access to the tool and future upgrades.
Our webinar is divided into three parts, which cover all aspects of stock analysis and peer analysis tools with over 10+ hours of content.
The first part has already been completed, but it's not too late to join us for the remaining two parts. By registering, you'll not only have access to both excel stock analysis tool and competitive analysis tool including the live sessions and receive recordings of previous session, allowing you to revisit the material whenever you need.
https://learn.scientificinvesting.in/learn/Company---Peer-Analysis-Excel-Tool
"Additionally, in the annexure section, we've included an image showcasing the various sheets available in our tool. These sheets cover a wide range of financial metrics and insights, providing a comprehensive toolkit for your investment analysis."


Thank You !!!